scat displays function call graphs of C programs. scat also displays the conditions that need to be satisfied for a function to be called.
scat allows a programmer to quickly comprehend the structure of a program.
Below is a demonstration of scat's user interface. Point at a function call arc to see the conditions that must be satisfied for that call to occur. Point at a function name to see the function's signature and where the function is defined.
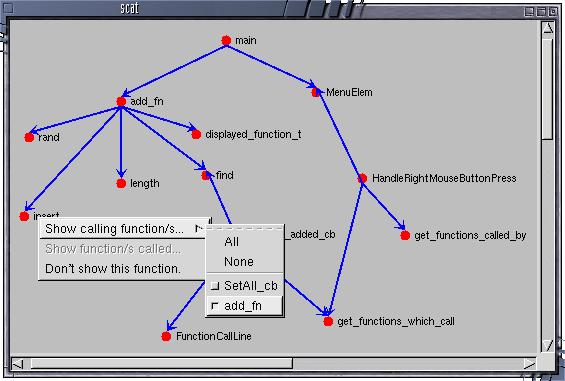
Below is an old picture showing a call graph being created interactively:

I used the GTK-- and GNOME-- libraries (which provide a C++ interface to GTK+ and GNOME). libsigc++ was also used.
The user specifies two functions and scat displays all the ways program execution can go from the first function to the other function.
Some functions such as malloc, free,
printf, etc. usually do not need to be displayed. The set of
functions which are not displayed can be specified.
The function call database is interrogated using cscope.
cbrowser uses cscope. It has a nice GUI for making cscope queries and it can also draw a function call tree.
Source Navigator can work with source code in many different languages. It seems to be slower than cscope at analysing C code.
I hope scat makes it possible to understand how programs are structured more quickly than with similar programs. (I've used v0.8 of cbrowser and v5.0.0 of Source Navigator.) Enhancements include:
This appears to be a difficult task. I am thinking of using the
library which doxygen uses to format graphs.
main and report the maximum stack usage,
doxygen to show documentation for functions.A basic save function has been implented: It only stores the names of the functions displayed (and nothing else). I am considering using libXML in future.
The code which determines the conditions for a particular function call to occur is not finished. Below is a list of some things that are yet to be done:
case labels inside switch statements are not
yet handled.break, continue and return
statements are not yet handled. (They cause a parse error which prevents
scat showing misleading information for code it can't yet
analyse.)I use gcc v3.0.3 to compile scat.
The following packages are required to build scat. I have listed the versions I have installed (older versions may also work).
| gtk | 1.2.9 |
| gtk-- | 1.2.8 |
| gnome-- | CVS 21/10/'01 |
| libsigc++ | 1.0.1 |
scat will use the cscope.out file in the current
working directory, however, you can specify a different file (or several files)
using the "Cscope Connections" window.
scat does not create nor update cscope databases. ("cscope
-Rb" will build a database for all files in the current directory and
sub-directories of the current directory. I recommend using the
cscope "-q" option as it increases the speed to
interrogate the database.)
Last update: 25 November 2002